


.webp)
.webp)
.webp)
.webp)






.webp)



%20(1).gif)

Register for the event
Endowus invites you to our exclusive event with Macquarie Asset Management, as we discuss unlocking opportunities in Infrastructure- a $1.3tn asset class.
This event is reserved for Accredited Investors (AIs) only. To register for the event, please indicate one of the following:
- The Flagship 100% Equity Portfolio fell 1.2% in July and underperformed the broad equity market which fell 0.9%. On the other hand, the 100% Fixed Income Portfolio declined 1.5%, underperforming the broad fixed income market, which fell 1.2%.
- Income Portfolios generated losses in July, but they all outperformed their respective benchmarks. Stable Income fell 1.1% and outperformed the broader credit market which fell 1.5%. Higher Income and Future Income both fell 0.6%, but outperformed their respective 20-80 and 40-60 benchmarks, which fell 1.4% and 1.3% respectively.
- Cash Smart portfolios continued to demonstrate their lower risk nature in July. Cash Smart Secure gained 0.1%, while Cash Smart Enhanced was flat, and Cash Smart Ultra fell 0.1%.
- For more on the market insights, click here.
Endowus Core-Flagship Cash/SRS Portfolio
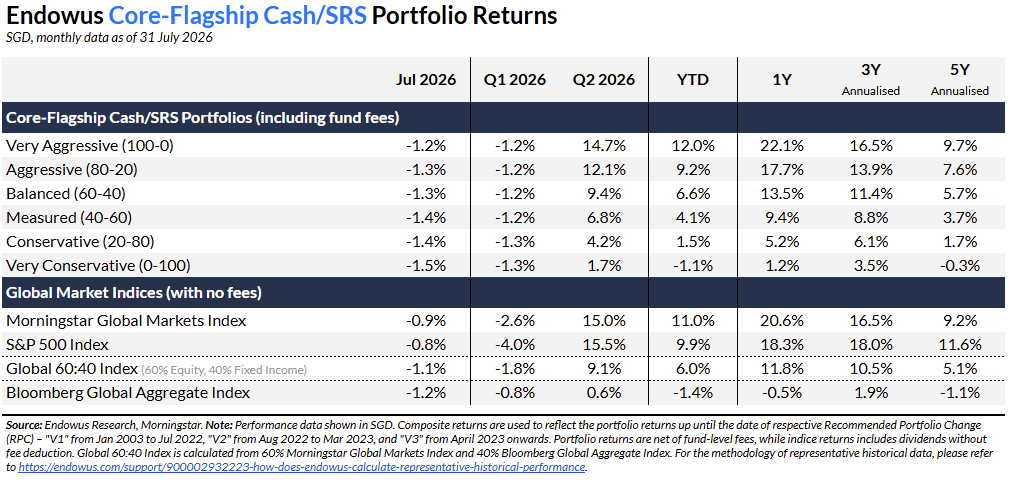
The 100% Equity Portfolio fell 1.2% in July, underperforming the broader equity market by 0.3%.
- July was characterized by pronounced sector rotation, with the overall effect being a 0.9% drop for global equities. Renewed tensions in the Middle East lifted energy stocks, though rising oil prices reignited fears of inflation. A selloff in fixed income also impacted equities as it signaled market concerns about debt sustainability. Offsetting some of these macro concerns, stronger-than-expected Q2 earnings offered reassurance that corporate profits could remain resilient. Even so, investor selectivity intensified. For instance, overvaluation concerns weighed heavily on semiconductor stocks, while financial stocks rallied on robust earnings.
- The Flagship Cash/SRS 100% Equity Portfolio fell 1.2% in July, underperforming the global equity market. The Portfolio underperformed due to its overweight to emerging market equities, which struggled given the larger concentration in AI hardware stocks (in particular, Korean and Taiwan). The Portfolio’s structural tilt to value stocks mitigated further underperformance, as value stocks outperformed their growth counterparts during the month.
- Within the Portfolio, the Dimensional Global Core Equity Fund was the best performer, ending the month up around 0.1%. The main driver was its focus on developed market equities, specifically those that are “value” in nature. In contrast, the Dimensional Emerging Markets Large Cap Core Equity Fund was the weakest performer, down 5.8%.
The 100% Fixed Income Portfolio fell 1.5% in July, underperforming the broader fixed income market by 0.3%.
- July proved to be challenging for global bonds, which dropped 1.2%. Rising oil prices driven by renewed tensions in the Middle East reignited inflation concerns, while additional fears of lack of fiscal discipline added to the selloff, pushing government bond yields higher. Within credit markets, performance was mixed. As spreads widened across the board, investment grade credit underperformed government bonds due to its longer duration profile. On the other hand, high yield credit held up better, insulated by its shorter duration and higher carry.
- The Flagship Cash/SRS 100% Fixed Income Portfolio fell 1.5% in July, underperforming the broader fixed income market. The Portfolio underperformed due to its overweight to emerging market and securitised bonds which saw weaker performance during the month.
- Within the Portfolio, the iShares Global Aggregate 1-5 Year Bond Index Fund fell 0.4% and was the best performer due its shorter duration. The main detractor was the iShares Emerging Markets Government Bond Index Fund, which ended the month down 2.2%. The Fund struggled due to its positions in emerging market bonds, with further losses coming from USD depreciation against SGD, as its underlying hard currency bonds are not hedged.
Endowus Core-Flagship CPF Portfolio
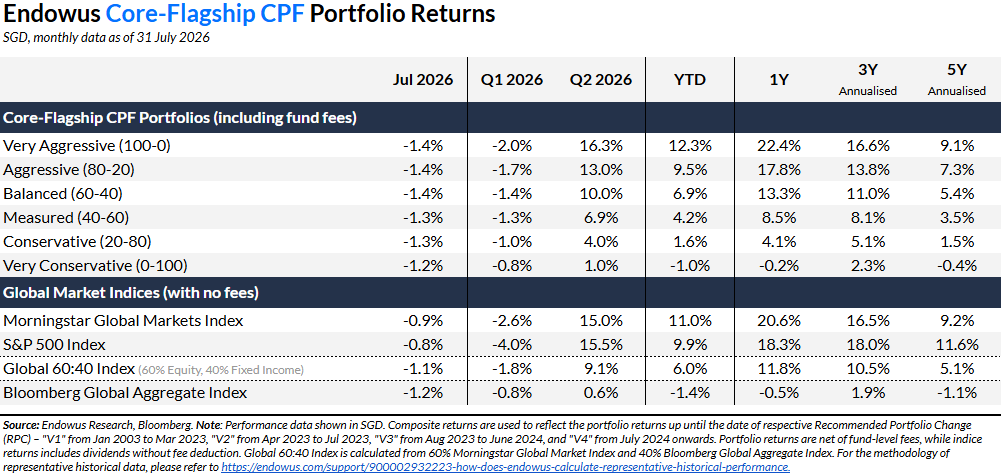
The 100% Equity Portfolio declined 1.4% in July, underperforming the global equity benchmark by 0.5%.
- Similar to the Cash/SRS 100% Equity Portfolio, the CPF 100% Equity Portfolio underperformed the global equity market due to its overweight to emerging market equities. However, this was mitigated by the Portfolio’s overweight to value stocks.
- Within the Portfolio, the Dimensional Global Core Equity III Fund was the best performer, ending the month with flat returns. The Fund benefitted from its overweight to value stocks, which outpaced their growth counterparts. On the other hand, the Dimensional Emerging Markets Large Cap Core Equity III Fund was the weakest performer, ending the month down 6.7%. The Fund struggled due to its exposure to emerging market equities.
The 100% Fixed Income Portfolio fell 1.2% in July, performing in line with the global fixed income benchmark.
- The Portfolio’s slightly shorter duration contributed to relative performance, though this was offset by its overweight to Singapore bonds, which underperformed.
- Within the Portfolio, the UOB United SGD Fund Fund was the best performer due to its shorter duration, falling 0.1%. On the other hand, the Eastspring Singapore Select Bond Fund fell 1.7% and was the weakest performer in July.
Endowus Income Portfolios
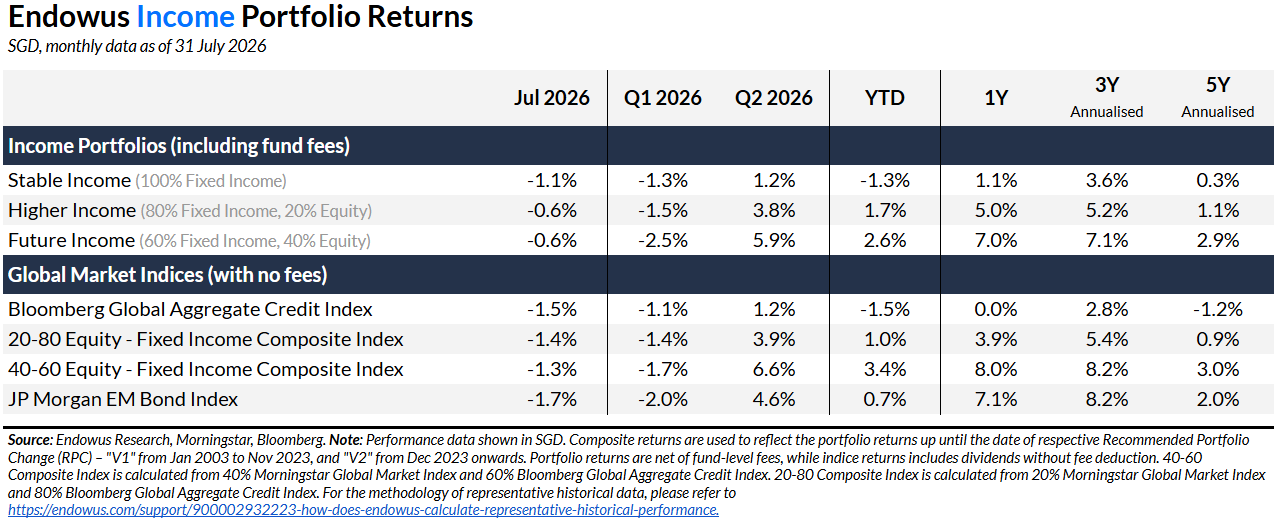
The Endowus Stable Income Portfolio fell 1.1% in July, outperforming the Bloomberg Global Aggregate Credit Index.
- The underlying funds were impacted by broad weakness across fixed income markets in July, as especially as the long end of the US Treasury curve sold off. Funds with longer duration positioning, such as the AB American Income Fund and PIMCO GIS Income Fund, took the hardest hit. Conversely, shorter-duration allocations—specifically the JPM Income Fund and Neuberger Berman Short Duration Emerging Markets Bond Fund—helped cushion the decline, resulting in relative outperformance against the benchmark.
The Endowus Higher Income Portfolio declined 0.6% in July, outperforming the 20-80 equity-fixed income composite benchmark.
- Accounting for 80% of the portfolio, the fixed income component outperformed the broader credit market, driven by its shorter duration stance. It also slightly outpaced Stable Income due to its allocation to high-yield bonds, which proved more resilient against July's interest rate movements, while credit spreads remained stable.
- The 20% equity sleeve generated positive returns (+0.6%), meaningfully outperforming the global equity market. This outperformance was largely driven by the portfolio’s tilt toward high-dividend stocks and real assets.
The Endowus Future Income Portfolio pulled back by 0.6% in July, outperforming the 40-60 equity-fixed income composite benchmark.
- The 60% fixed income sleeve outperformed global credit markets, mirroring the performance of the Stable Income Portfolio.
- Similarly, the 40% equity sleeve outpaced global equities, and this is supported by the portfolio’s tilt toward high-quality and low-volatility stocks.
Latest portfolio update:
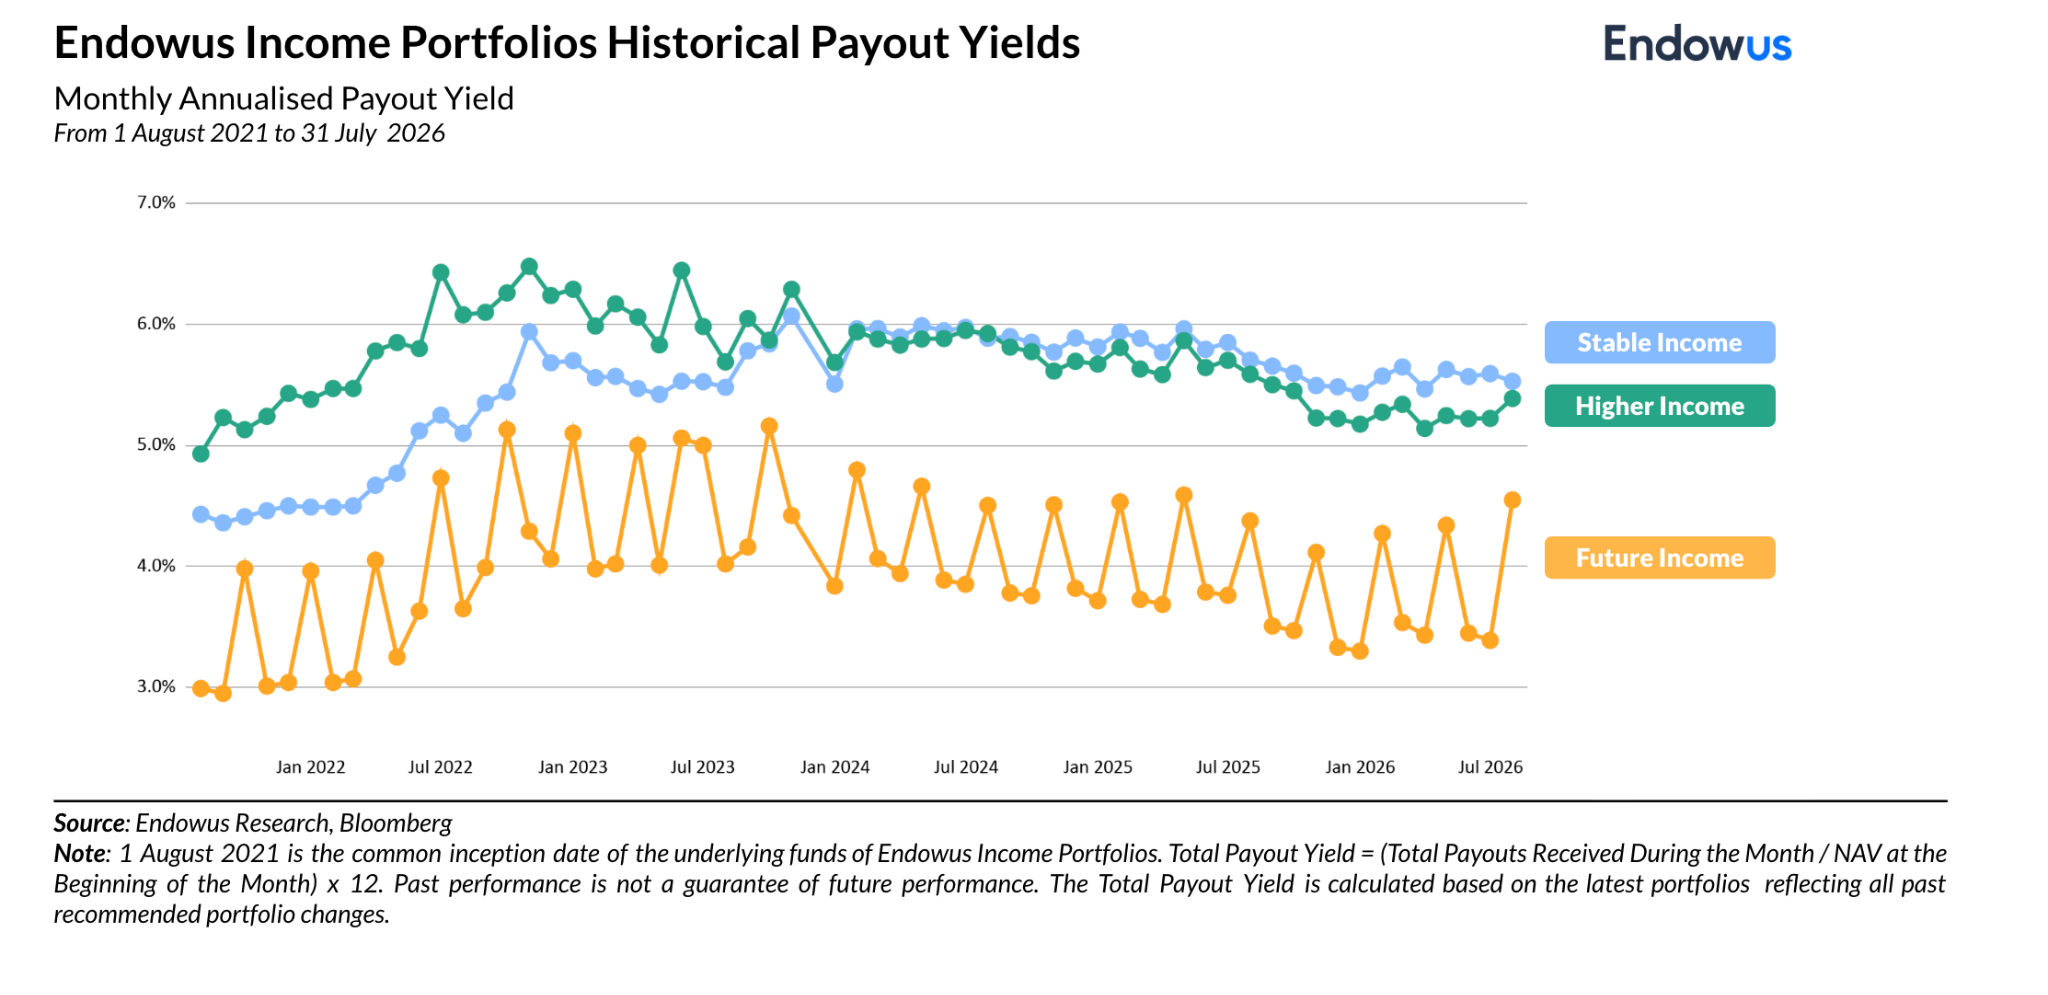
In September 2025, we revised the target payout of the Higher Income Portfolio downwards to 5–6%. The increase in hedging costs between the SGD and USD has caused certain fund managers to lower their payouts, impacting overall payout levels across all three Income Portfolios. This in particular caused the Higher Income Portfolio's payout yield to dip below its prior target range. In light of the prevailing interest rate cycle, we believe it is prudent to maintain this lower target payout range.
Investment-grade flexible income funds continue to generate income comparable to high-yield funds in the current environment, where high-yield credit spreads remain particularly tight. As a result, the Higher Income Portfolio's payout yield is currently similar to that of Stable Income. However, it is important to note that the Higher Income Portfolio has delivered stronger growth in total return than Stable Income, thanks to its prudent addition of credit and equity risk. This means that after receiving income distributions, investors in the Higher Income Portfolio have seen a stronger increase in their invested capital.
In line with our commitment to continuously improve the portfolios, we have made targeted fund selection upgrades to the Higher Income Portfolio in June 2026. These changes replace a number of funds with higher-quality alternatives that we believe will deliver better risk-adjusted total returns over time, while maintaining the same target payout of 5–6% per annum and the same overall asset allocation (80% fixed income, 20% equities). For more detailed information on the portfolio change, please refer to this article. Portfolio statistics from July 2026 onwards for Higher Income Portfolio will reflect the latest allocation post recommended portfolio changes.
Endowus Cash Smart Portfolios
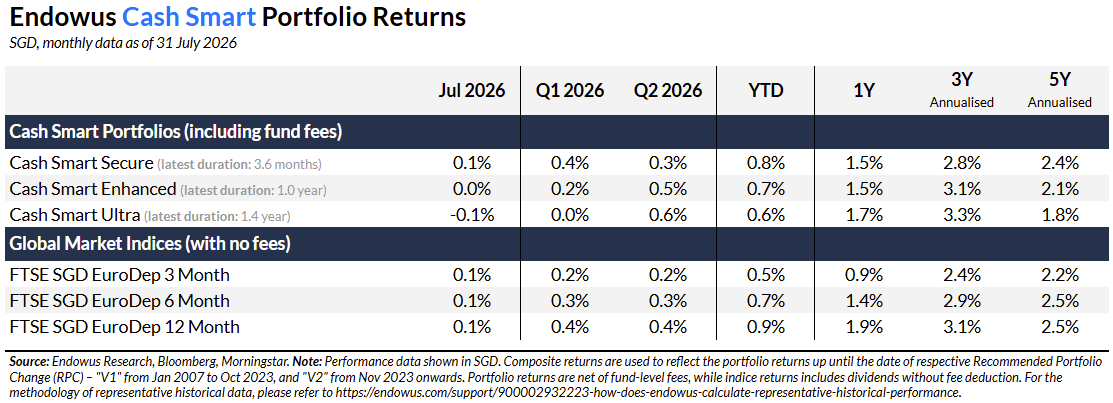
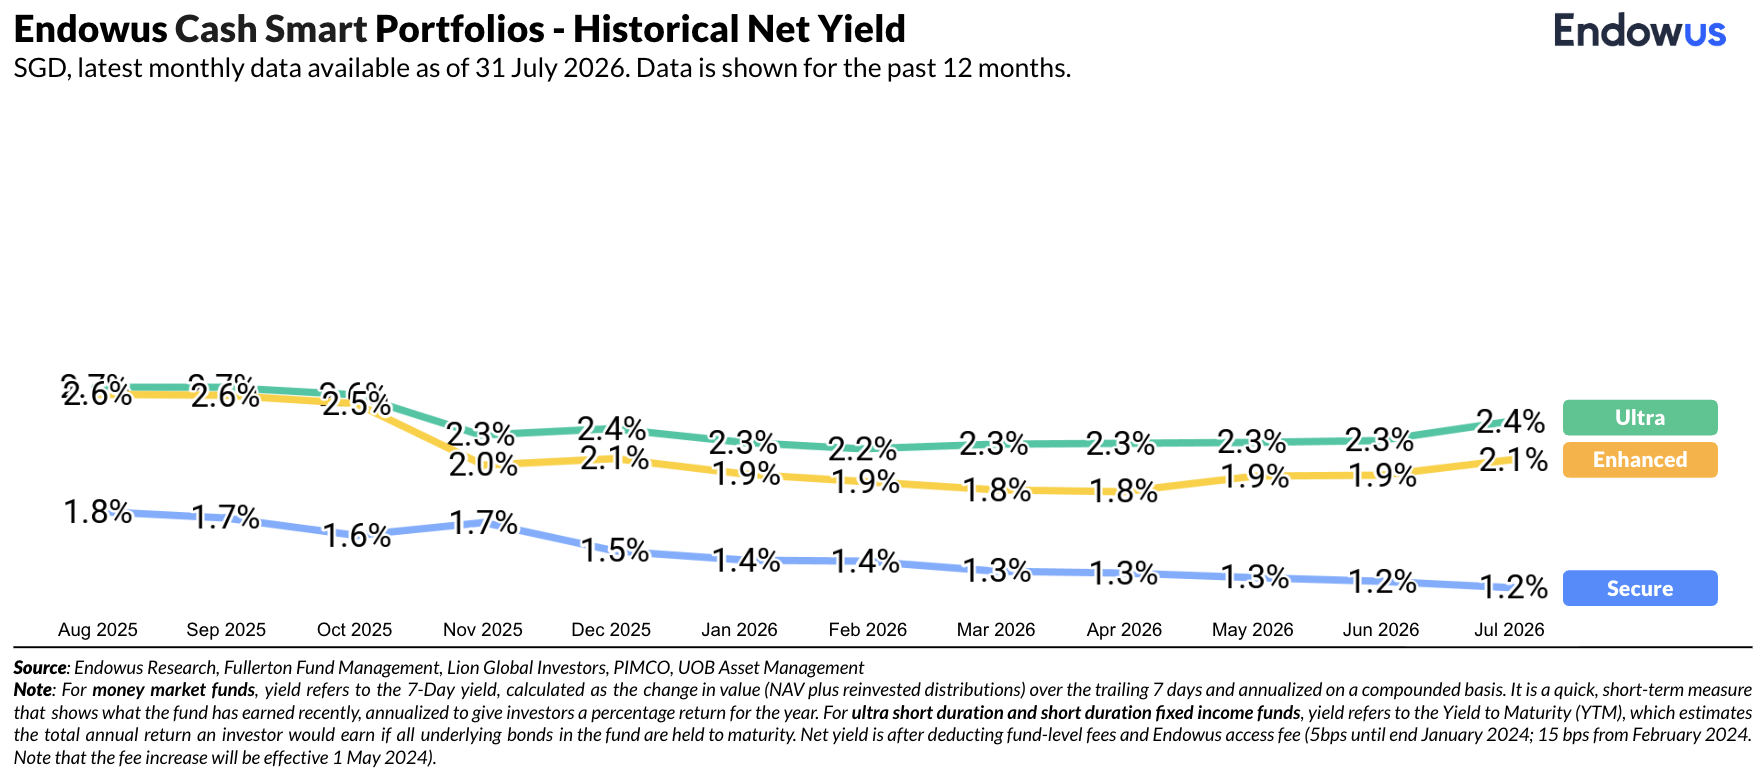
Cash Smart Secure continued to generate stable returns in July, despite a turbulent month for financial markets.
- The Cash Smart Secure Portfolio maintained its stable return profile, posting a 0.1% gain.
- Both the underlying funds, the Fullerton SGD Cash Fund and the LionGlobal SGD Enhanced Liquidity Fund, returned 0.1%.
Cash Smart Enhanced ended July with flat returns.
- Cash Smart Enhanced ended the month with flat returns, as its overall performance was weighed down by its allocation to short duration bonds via the UOB United SGD Fund, which had a slight decline of 0.1%.
Cash Smart Ultra fell 0.1% in July as it has the highest risk profile.
- Cash Smart Ultra ended July down 0.1%. Weaker performance was driven mainly by the short duration bond funds, as the rise in yields weighed more heavily on them.
- Performance across all three short-duration bond funds was negative, led by the PIMCO GIS Low Duration Income Fund with the largest drop at 0.5%.
Please note: There has been a change in the benchmark due to the discontinuation of the 3-month SIBOR. The new benchmarks feature higher returns than SIBOR, but our Cash Smart Portfolios have tended to outperform them across various periods.
With the digital wealth platform, Endowus, you can plan and manage your money—whether held in cash, CPF, or SRS—by investing in globally diversified, intelligent, low-cost portfolios seamlessly. To get started, click here.
Endowus Q1 & March 2025 Portfolio Performance Review

Endowus Q3 2024 Performance Review

Endowus Q2 2024 Performance Review
.jpg)



%20F1(2).webp)

.webp)
.webp)






.webp)